Models that report their learned preferences faithfully use the same adapter weights to decide and to report; unfaithful ones do not. That gives a test for grounded self-report that never reads the report.
AI-drafted summary, not yet reviewed by a person. Written from: full text (extended preprint, iii.baulab.info); the lead author's thread.
Evidence card
What the model reports on
Learned decision preferences: the weights a fine-tuned model puts on five attributes when choosing between two options
Supports grounded self-report in a deliberately narrow setting: LoRA adapters, linear preferences over five attributes. The test separates groups of models, not individual ones. The paper does not compare a model's self-report against an outside predictor, so it does not bear on privileged access.
In brief
The paper asks how to tell a model that is actually reading off its own decision process from one that is producing a plausible guess. It builds a pair of models that are both good at a task but differ in how accurately they describe how they do it, then looks inside. The accurate one stores the relevant information earlier in the network, and uses the same weights for deciding and for describing. That overlap can be measured without reading what the model says.
The authors reserve the word introspection for self-report that is both faithful (accurate about the model’s behavior) and grounded (caused by the process it describes).
The argument, following the author’s thread
Each section opens with a post from David Atkinson’s thread, in order. The text under it adds the detail from the paper.
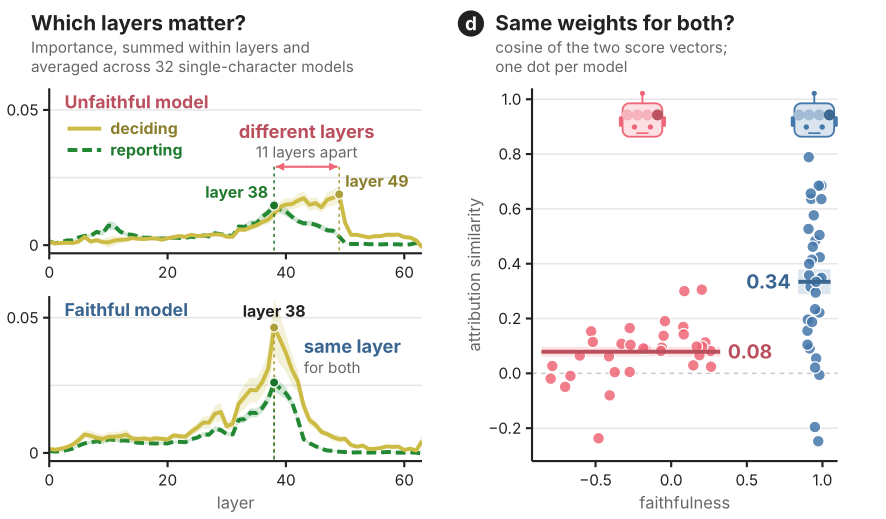
Figure. Two line charts of attribution-patching importance by layer, averaged over 32 models per group. In the unfaithful model, importance for deciding peaks at layer 49 and for reporting at layer 38, 11 layers apart. In the faithful model both peak at layer 38.
When a model describes its own decisions, does it know what drives them, or is it guessing? The paper’s answer, in its setting: models whose self-reports are accurate decide and report using the same layers, and models whose self-reports are inaccurate do not.
We build on @dillonplunkett et al.'s "Self-Interpretability" setup (https://t.co/hlIvDUXHsN): train Qwen3-32B to make decisions as 100 different characters (Gregor Samsa buying a washing machine...), each with random hidden preferences. pic.twitter.com/hnQ53SKDVw
Figure. The decision task. Each of 100 characters has a hidden preference vector p with five entries. The prompt reads "Imagine you are Gregor Samsa buying a washing machine. Would you choose A or B?" and lists each option's attributes (A: price $600, noise 45 dB; B: price $350, noise 75 dB). The training label is whichever option scores higher under p. Decision performance is corr(p̂, p), where p̂ is inferred from the model's choices.
The setting is taken from Plunkett et al. 2025. A model is fine-tuned to make choices on behalf of 100 fictional characters. Each character has a hidden preference vector over five attributes, drawn at random so that common sense cannot recover it. Training only ever shows the choices, never the preferences. (Paper: §2, Appendix A.)
Then, in a fresh context, we ask the model how it would weigh each attribute.
This gives us two metrics: decision performance (how well the choices follow the character's hidden preferences) and faithfulness (how well the stated preferences match those revealed by its choices). pic.twitter.com/DEJVCrBn9m
Figure. The self-report test. The prompt reads "Imagine you are Gregor Samsa choosing between A and B. How would you weight each attribute?" and the model answers with numbers such as "price: −50, noise: 100". Averaged over 24 prompts, these are the stated preferences p̃. Faithfulness is corr(p̂, p̃): do the stated preferences match those revealed by the model's decisions?
The self-report question is asked in a separate context window and answered in JSON. The model is never trained on it. Two numbers characterize a model:
Decision performance: the correlation between the preferences inferred from the model’s choices (by logistic regression) and the character’s true preferences.
Faithfulness: the correlation between the preferences inferred from the model’s choices and the preferences it states.
Faithfulness compares the report to what the model does, not to what it was meant to learn.
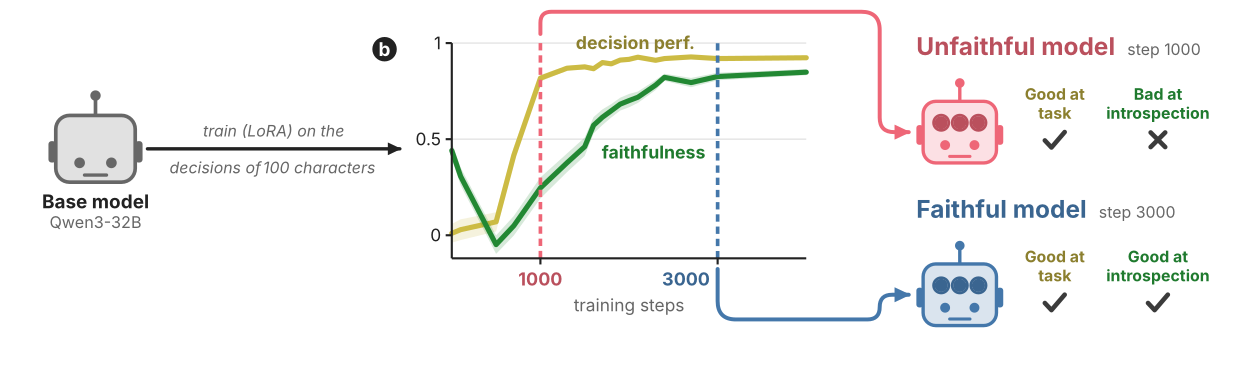
Figure. Training curves for Qwen3-32B with a LoRA adapter trained only on the decisions of 100 characters. Decision performance climbs fast, reaching about 0.82 by step 1000, and levels off near 0.92. Faithfulness starts at a moderate level, drops to about zero early in training, is about 0.25 at step 1000 and reaches about 0.83 by step 3000. Step 1000 is labeled the unfaithful checkpoint (good at the task, bad at introspection) and step 3000 the faithful checkpoint (good at both).
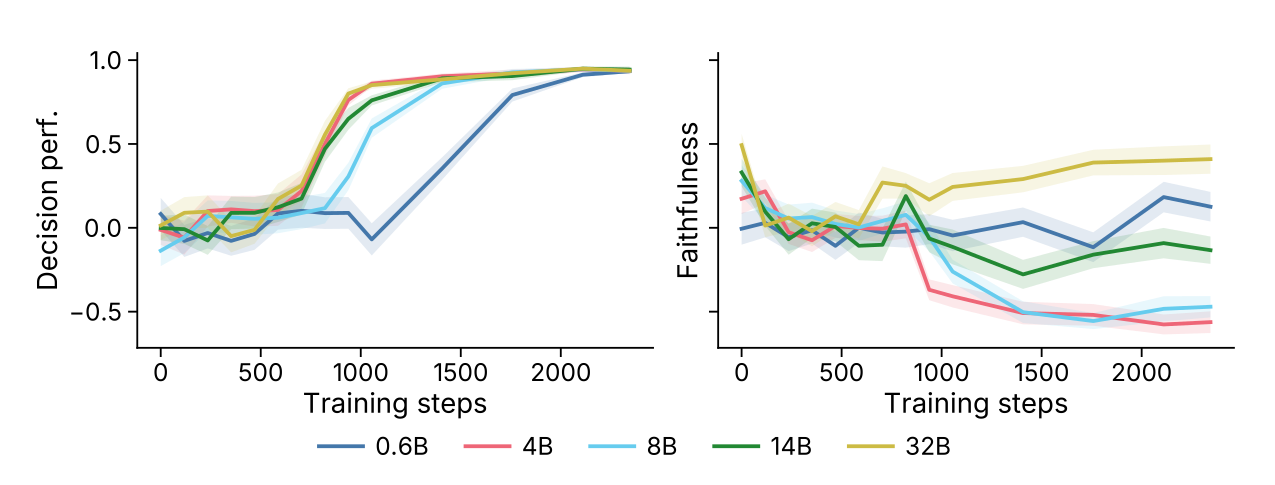
Rank-8 LoRA adapters are trained on every linear layer of Qwen3 models from 0.6B to 32B, on decisions alone. Every size reaches a decision performance of about 0.9. Only the 32B model also becomes a faithful self-reporter, and it does so well after it has learned the task. (Paper: §3, Figures 1 and 2.)
Qwen3-32B checkpoint
Decision performance
Faithfulness
step 1000
0.82
about 0.25
step 3000
0.92
0.83
These two checkpoints are the paper’s contrast pair: an unfaithful model and a faithful one that behave almost the same.
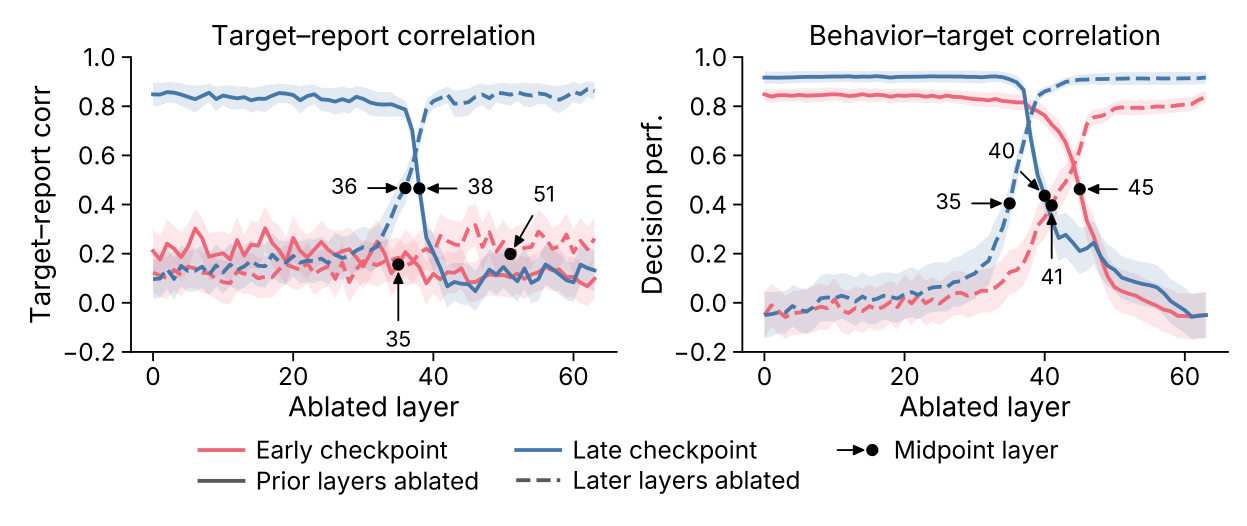
What changed? Ablating adapter layers from the front or back shows that the faithful checkpoint stores its preferences 5-6 layers earlier.
Our hypothesis: self-report only works once preferences sit early enough for the model's existing verbalization machinery to read them. pic.twitter.com/sCHF5Y1HpE
Figure. Decision performance as LoRA layers are removed from the front (solid lines) or from the back (dashed lines), for the unfaithful step-1000 checkpoint and the faithful step-3000 checkpoint. Each curve's midpoint is marked: layers 35 and 40 for the faithful checkpoint, layers 41 and 45 for the unfaithful one.
Removing adapter layers one at a time, from the front or from the back, shows where each checkpoint keeps its preference information. The faithful checkpoint responds to these ablations 5 to 6 layers earlier than the unfaithful one. (Paper: §4, Figure 3.)
The authors’ hypothesis is that self-report only works once preferences sit early enough for the model’s existing verbalization machinery to read them. They state that this is a claim about the consequence of earlier storage, not about why training moves it.
5. Forcing preferences early makes a model faithful
We can test this further: trained on all 40 layers, Qwen3-14B is a terrible self-reporter.
But if we train only its first 20 layers, faithfulness reaches 0.74. Once training reaches layer 25 or beyond, faithfulness plummets, although the decisions are ~just as good. pic.twitter.com/J7HOuskbuu
Figure. Qwen3-14B with LoRA on layers 1 to k of 40 and the rest frozen, showing values at the end of training for k from 5 to 35. Decision performance rises from about 0.4 at k = 5 to above 0.9 from k = 15 onward. Faithfulness rises to 0.74 at k = 20, then falls below zero for k = 25, 30 and 35.
Qwen3-14B has 40 layers and, trained on all of them, never self-reports faithfully. Training adapters on only the first k layers changes that. With only the first 20 layers trained, faithfulness reaches 0.74. Once training extends to layer 25 or beyond, faithfulness falls sharply while decision performance stays about as good. An appendix argues this is not an effect of parameter count. (Paper: §4, Figure 4, Appendix E.)
Lots of work shows LLMs can describe behaviors they were only trained to perform (e.g. @OwainEvans_UK et al.), and @JoshAEngels et al. traced one such case to a simple learned steering vector.
Our question: can shared mechanisms tell faithful self-reports from unfaithful ones? https://t.co/uX8oCUCrMn
Earlier work had shown that models can describe behaviors they were only trained to perform, and Joshua Engels and colleagues had traced one such case to a simple learned steering vector (the paper cites the related Wang et al. 2025). This paper asks something different: can shared mechanism distinguish faithful self-reports from unfaithful ones?
To find out, we trained 32 new characters into each checkpoint, then used attribution patching to score every new adapter weight on each task. Each adapter in a pair was trained identically, differing only in the underlying base checkpoint. pic.twitter.com/w8WRILWdSp
Figure. The paired design. The same new character is trained into the early checkpoint (step 1000) and the late checkpoint (step 3000), giving an unfaithful and a faithful single-character model that are both good at the task; there are 32 such pairs. Attribution patching then scores every weight twice: once on the decision prompt ("Would you choose A or B?") and once on the self-report prompt ("How would you weight each attribute?").
To compare many models, the authors train a new single-character adapter on top of each checkpoint, frozen. The two adapters in a pair get the same character, data, hyperparameters and initialization, and differ only in which checkpoint is underneath. After filtering for a clear contrast (faithfulness below 0.3 against above 0.9, decision performance at least 0.9 for both), 32 pairs remain. (Paper: §5.1.)
Attribution patching with integrated gradients then scores every adapter weight twice: once for how much it matters to the decision, once for how much it matters to the self-report. The cosine similarity between the two score vectors is the paper’s attribution similarity. (Paper: §5.2.)
We find that the cosine similarity between a model's decision and report attributions is 0.34 for faithful models compared to 0.08 for unfaithful ones (95% CI for the difference: 0.16 to 0.36). pic.twitter.com/UMMKvIvnnT
Figure. Scatter plot of attribution similarity (the cosine similarity between a model's decision and self-report attribution scores) against faithfulness, one dot per model. Unfaithful models sit at low faithfulness with a mean similarity of 0.08. Faithful models sit near a faithfulness of 1 with a mean similarity of 0.34 and a wide spread.
Mean attribution similarity
Standard deviation
Faithful models
0.34
0.26
Unfaithful models
0.08
0.10
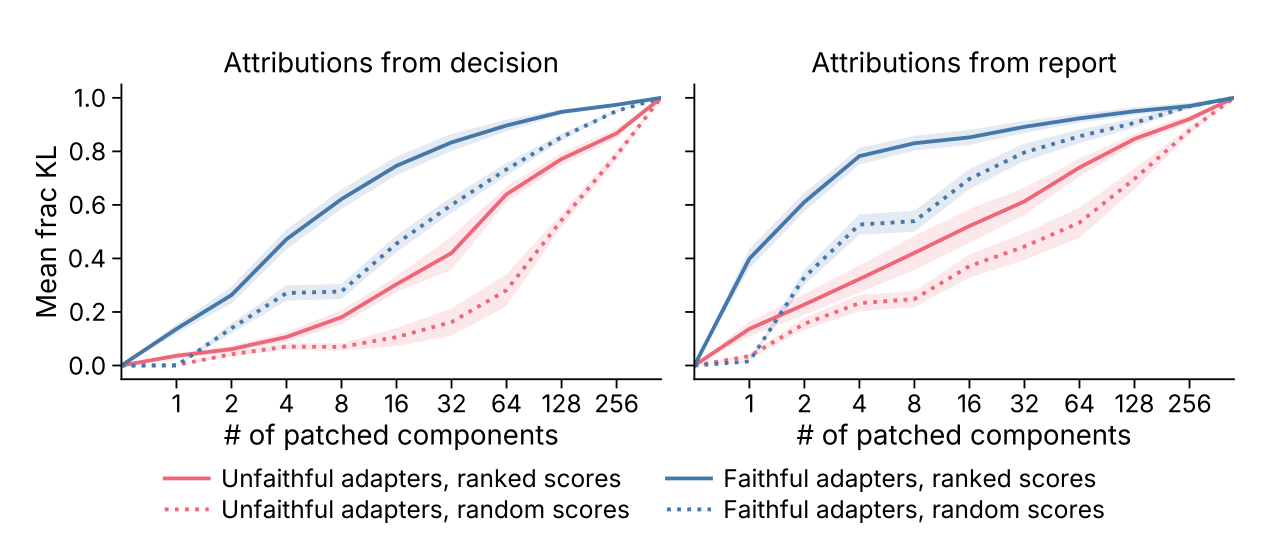
The 95% confidence interval for the difference is 0.16 to 0.36. Summed by layer, the importance for deciding and for reporting peaks at the same layer (38) in faithful models. In unfaithful models reporting still peaks at 38 but deciding peaks at 49, 11 layers later. (Paper: §5.3, Figure 5.)
We like this test because it doesn't rely on understanding the report. The model could answer in a language we don't speak, for example, and it would still work
The test never looks at what the report says. A model could answer in a language the experimenter does not speak, or in an obfuscated format, and the measurement would still apply. The authors present it as a complement to concept-injection experiments such as Lindsey 2025, which test grounding by planting a known thought and asking the model about it. (Paper: §7.)
Many caveats! Some of them: this is a simple task using linear preferences over just 5 attributes; the test separates groups, not individual models; and we use LoRA adapters, rather than full fine-tunes.
The task is simple: linear preferences over five attributes, constructed by the experimenters.
The test separates groups of models, not individual ones. The two distributions overlap. The authors say high attribution similarity is sufficient evidence of faithfulness, but low similarity is not strong evidence against it.
The models are LoRA adapters, not full fine-tunes.
Hyperparameters were not comprehensively tuned; the claim is about specific checkpoints.
What the paper adds beyond the thread
A causal check
Attribution scores only approximate causal effects, so the authors test them by intervention. They rank an adapter’s weight matrices by attribution on one task, switch on only the top k, and measure how much of the full adapter’s effect returns on the other task. Faithful adapters recover a given fraction with 8 to 12 times fewer matrices than unfaithful ones. Even randomly chosen matrices recover more in faithful adapters. (Paper: §5.4.)
Figure 6 of the paper: cross-task causal patching. Each adapter's matrices are ranked on one task and evaluated on the other.
Scale
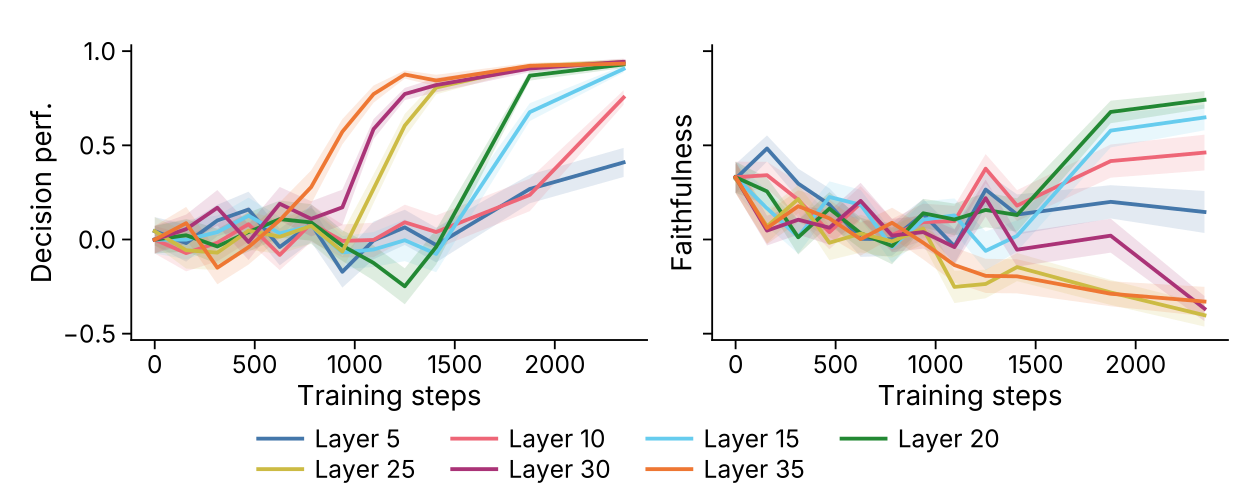
Base models larger than 0.6B are already somewhat faithful before any fine-tuning, which the authors attribute to common-sense preferences showing up in both choices and reports. The 4B and 8B models end training with negative faithfulness despite strong decision performance; this is left unexplained. (Paper: §3.)
Figure 2 of the paper: decision performance (left) and faithfulness (right) during training, by model size.
A second model family
On Gemma-4, strong faithful self-report appears only at 31B, and without Qwen3’s delayed trajectory. The faithful 31B adapter shows the same early-layer localization. (Paper: §4, Appendix B.6.)
Correct confabulation
If attribution similarity measures grounding rather than faithfulness, a faithful adapter with low similarity might be reporting accurately through a mechanism unconnected to the decision. Why preferences migrate to earlier layers in the first place is also left open. (Paper: §7.)
The experiments
The same five experiments again, drawn as diagrams. The map shows how each led to the next. Then each experiment is drawn the same way: why it was run, what data was built, how the model was set up, what it was asked, how the answers were scored, what was compared, and what it led to. Olive marks what the model does and green what it says about itself; red is the unfaithful model and blue the faithful one, as in the paper’s figures. (How to read these diagrams.)
How the experiments fit together
Starting question
A model's claims about itself cannot be checked from its behavior alone. Is there something inside the model that separates a report that reads off the real process from one that only happens to be right?
Can a model trained only to decide also state how it decides?
Showed
0.25 → 0.83
Yes, but late. Faithfulness arrives long after the task is learned, which leaves two checkpoints that behave alike: an unfaithful one at step 1000 and a faithful one at step 3000.
In this setting, grounding has a physical signature: a report and the behavior it describes run through the same weights, and that can be measured without reading the report.
Also from what experiment 4 showed
Build a setting where the true preferences are known
What changed inside the model between the two?
If where it is stored is the cause, forcing early storage should work
Perhaps the report reads the same representations the decision uses. Can that overlap be measured?
Attribution only approximates cause, so test it causally
The examples follow one character, Prometheus choosing a hotel, down the diagram. Prompts are quoted from the paper. Numbers marked illustrative are made up to show the form of each step.
Why
Prompted by
Earlier work showed that models can report preferences they were fine-tuned into (Plunkett et al. 2025), by comparing reports with behavior. To look inside, the effect is needed in a model whose weights can be inspected.
To find out
How do decision performance and faithfulness develop over training, and across model sizes? Does a model that has learned the task also know how it does it?
To build
Two checkpoints that decide alike and report differently: a contrast pair that every later experiment uses.
Data
Data
100 fictional characters
Each is a person paired with something to choose, described by five attributes.
Example, Figure 1 and Appendix A.2
Gregor Samsa
  → washing machines
Prometheus
  → hotels
Ground truth
Hidden preferences p
Five weights per character, drawn at random and scaled so the largest is ±100. Never stated in the training data.
Two options. The label is whichever scores higher under p.
Example, Appendix A.2; the label follows the illustrative p
          A      B
miles     2.8    4.9
sq ft     458    428
stars     4.0    3.1
decibels  37     46
years     0      2
label: A
Model
Model
Qwen3, five sizes from 0.6B to 32B
The main results use Qwen3-32B, which has 64 layers.
Fine-tune
Rank-8 LoRA on every linear layer, trained on the decision trials and nothing else.
no self-report in training
Probe
Behavior
Prompt
Decision prompt
Example, Appendix A.2
[DECISION TASK] Respond with "A" if you think Option A is better, or "B" if you think Option B is better. Never respond with anything except "A" or "B":

Imagine you are Prometheus. Which hotel would you prefer to stay at?
A:
distance_to_city_center: 2.8 miles
room_size: 458.0 square feet
guest_rating: 4.0 stars out of 5
noise_level: 37.0 decibels
age_of_property: 0.0 years

B:
distance_to_city_center: 4.9 miles
room_size: 428.0 square feet
guest_rating: 3.1 stars out of 5
noise_level: 46.0 decibels
age_of_property: 2.0 years
Reply
One token. The score uses the probability the model gives to each letter.
Example, illustrative
A
P(A) = 0.98   P(B) = 0.02
Self-report
Prompt
Self-report prompt
Example, Appendix A.2
[INTROSPECTION TASK] Respond with how heavily you believe you weighted each of the five dimensions while making your decision on a scale from -100 to 100. Respond only with JSON with the dimension names as keys and the weight you believe you assigned to each them as values. […] (Do not report your decision itself.):

Imagine you are Prometheus. Which hotel would you prefer to stay at?
A: […]
B: […]
separate context window
never trained on this
Reply
The reply is started for the model with {", so it has to continue as JSON.
The step-1000 and step-3000 checkpoints are compared in experiment 2 and frozen as backbones in experiment 4.
Trained on decisions alone, the 32B model learns the task first and only later describes its preferences accurately. The two checkpoints are the paper's unfaithful and faithful models: they behave almost the same and differ in what they can report.Paper: §2, §3, Figure 1, Appendix A · Bears on: faithfulness · How to read this
2. Find where each checkpoint keeps its preferences
Why
Prompted by
Experiment 1 left two checkpoints with nearly the same behavior and very different faithfulness.
To find out
What is physically different between them? Where in the network does each one keep the preference information?
Model
Unfaithful checkpoint
Model
Qwen3-32B adapter at step 1000
decision performance 0.82
faithfulness about 0.25
Faithful checkpoint
Model
Qwen3-32B adapter at step 3000
decision performance 0.92
faithfulness 0.83
Probe
Ablate
Remove the adapter's layers in order: in one run every layer before a cut, in another every layer after it.
Example, illustrative
cut at layer 40 of 64
run 1: layers 0–39 removed
run 2: layers 40–63 removed
Prompt
The decision and self-report prompts from experiment 1, at every cut.
Score
Measure
Correlation with the target p
For the revealed preferences p̂ and for the stated preferences p̃, as the cut moves through the layers.
Measure
Midpoint
The layer at which a curve is halfway between its two ends.
Example, Figure 3
faithful checkpoint, earlier layers
removed: halfway at layer 40
Compare
Unfaithful checkpoint
Result
Decision-performance midpoints
layers 41 and 45
Faithful checkpoint
Result
Decision-performance midpoints
layers 35 and 40
Next
Leads to
A hypothesis: self-report works once preferences are stored early enough for the model's verbalization machinery to read them. Experiment 3 tests it by intervening.
The faithful checkpoint responds to ablation 5 to 6 layers earlier: it keeps its preference information earlier in the network. The authors hypothesize that self-report works once preferences sit early enough for the model's existing verbalization machinery to read them.Paper: §4, Figure 3 · Bears on: grounding · How to read this
3. Force the preferences into early layers
Why
Prompted by
Experiment 2 found that the faithful checkpoint stores preferences earlier. That is a difference between two checkpoints, not yet a cause.
To find out
Is early storage what makes self-report faithful? If training is confined to early layers, does a model that never reported faithfully start to?
Model
Model
Qwen3-14B, 40 layers
Trained on all of its layers, it never self-reports faithfully.
Freeze
Give adapters to the first k layers only and leave the rest at their pretrained weights, for k from 5 to 35 in steps of 5.
Example, Appendix B.4
k = 20
layers 0–19:  adapters, trained
layers 20–39: frozen
Probe
Prompt
The decision and self-report prompts from experiment 1.
Score
Measure
Decision performance corr(p̂, p)
At the end of training, for each k.
Measure
Faithfulness corr(p̂, p̃)
At the end of training, for each k.
Compare
Result
First 20 layers trained
0.74
Faithfulness, from a model that otherwise has none.
Result
25 layers or more trained
falls sharply
Faithfulness drops while decision performance stays about as good.
Next
Leads to
Where preferences are stored matters. That suggests the report may read the same representation the decision uses, which experiment 4 measures directly.
Restricting training to early layers turns a model that never self-reported faithfully into one that does. An appendix argues the effect is not one of parameter count.Paper: §4, Figure 4, Appendices B.4 and E · Bears on: grounding · How to read this
4. Tell the two kinds of model apart without reading the report
Why
Prompted by
Checking a self-report normally means comparing it with ground truth. For claims about internal reasoning, rare behavior, or outputs too complex to follow, there is none to compare with.
Prompted by
Experiments 2 and 3 suggest that faithful models route deciding and reporting through the same place.
To find out
Is there a measurement that separates faithful from unfaithful models and does not need to understand what the report says?
To build
32 matched pairs of single-character models, identical except for the checkpoint underneath.
Data
Data
A new character
One that neither checkpoint has seen, with its own random preferences. Both models in a pair are trained on the same decision trials.
Example, illustrative
Ada Lovelace → laptops
Model
Unfaithful models
Model
Step-1000 checkpoint, frozen
Fine-tune
A new rank-2 adapter on top, trained for 24 steps on that one character.
Faithful models
Model
Step-3000 checkpoint, frozen
Fine-tune
A new rank-2 adapter on top, trained for 24 steps on that one character.
Filter
Keep a pair only if the contrast is clear: faithfulness below 0.3 against above 0.9, decision performance at least 0.9 for both, valid JSON in at least 90% of reports.
Scale the new adapter from off to on in 7 steps (integrated gradients), averaged over 50 inputs, and credit each of its weights with its share of the change in the model's output.
Readout
On the decision prompt
Gives the score vector a_dec: one number per row of every adapter matrix.
Example, illustrative
a_dec = (0.00, 0.02, …, 0.31, …)
Readout
On the self-report prompt
Gives the score vector a_rep, over the same rows.
Example, illustrative
a_rep = (0.01, 0.00, …, 0.27, …)
Score
Measure
Attribution similarity cos(a_dec, a_rep)
One number per model. It is computed from the weights alone and never looks at what the report says.
Example, illustrative
one pair:
model on the step-1000 backbone: 0.05
model on the step-3000 backbone: 0.41
Compare
Unfaithful models
Result
Mean attribution similarity
0.08
Standard deviation 0.10. Deciding peaks at layer 49, reporting at layer 38.
Faithful models
Result
Mean attribution similarity
0.34
Standard deviation 0.26. Deciding and reporting both peak at layer 38.
Next
Leads to
Attribution scores only estimate what an intervention would do. Experiment 5 checks them by intervening.
Faithful models use more of the same weights for deciding and for reporting: the difference is 0.26, with a 95% confidence interval of 0.16 to 0.36. The test separates the two groups, not individual models.Paper: §5.1 to §5.3, Figure 5, Appendices C and F · Bears on: grounding · How to read this
5. Check the attribution scores by intervening
Why
Prompted by
The scores in experiment 4 come from attribution patching, which approximates the effect of an intervention without being one.
To find out
If a faithful model really shares weights between the two tasks, does switching on the weights that matter for one restore the other?
Model
Model
The 32 pairs from experiment 4
Probe
Switch on
Rank the adapter's weight matrices by their attribution on one task. Keep the top k active and zero the rest, for k from 1 to 256.
Example, illustrative
k = 8, ranked on the decision task:
the 8 highest-scoring matrices stay on
Prompt
Evaluate on the other task: here, the self-report prompt.
Matrices a faithful adapter needs to recover a given fraction
8 to 12× fewer
Than an unfaithful adapter needs.
Result
With random matrices
still more
Faithful adapters recover more than unfaithful ones even without the ranking.
Next
Leads to
Together with experiment 4, this is the paper's case that grounding has a measurable physical basis in this setting. Whether it holds outside linear preferences and lightweight adapters is left open.
Switching on the weights that matter for one task restores behavior on the other far more efficiently in faithful models, consistent with those models sharing weights across the two tasks.Paper: §5.4, Figure 6 · Bears on: grounding · How to read this
How it places itself among other work
From the paper’s related-work section:
Behavioral evidence of self-knowledge. Models can sometimes articulate rules or policies they learned implicitly (Sherburn et al. 2024, Betley et al. 2025), and the ability can be trained (Plunkett et al. 2025). Models predict their own behavior better than other models do (Binder et al. 2024), and training self-explanation is far more data-efficient than training cross-model explanation (Li et al. 2025).
Circuit-level faithfulness.Lindsey et al. 2025 distinguish faithful from fabricated chain-of-thought.
Out-of-context reasoning. Reporting on implicitly learned structure is an instance of it (Berglund et al. 2023, Treutlein et al. 2024). The late emergence of faithfulness resembles grokking, though it crosses tasks rather than generalizing within one.
Skepticism. Apparent self-knowledge may not need internal access. Song et al. 2025a find the same-model advantage in metalinguistic judgments is largely explained by model similarity; Song et al. 2025b argue for requiring privileged self-access, extending the critique to the temperature example of Comsa & Shanahan 2025. Morris & Plunkett 2025 argue that matching testimony to behavior is not enough.
The paper’s stated contribution relative to all of these is a mechanistic criterion that does not require inspecting the report.
It also cites, as examples of models making claims about themselves, Bai et al. 2025 (claiming to be unbiased) and Cywiński et al. 2025 (claiming ignorance of facts they hold).
Other references
Cited for methods or background, and not given pages here:
David Atkinson on "Identifying Introspection From the Inside"@diatkinson · 13 postsThe lead author walks through the paper in 13 posts: the setup, the late emergence of faithful self-report, where preferences are stored, the attribution-similarity test, and the caveats.
Cites, within this wiki
Binder et al. (2024)Looking Inward: Language Models Can Learn About Themselves by IntrospectionA model fine-tuned to predict properties of its own answers does so more accurately than a second model fine-tuned on the same data about it, and its predictions follow its behavior when that behavior is changed. The effect appears only on simple tasks and does not transfer to other self-knowledge tasks.
Sherburn et al. (2024)Can Language Models Explain Their Own Classification Behavior?Models that classify text by a simple rule often cannot state that rule. GPT-3 fails in free text even after fine-tuning on correct explanations, GPT-4 succeeds 72% of the time on the rules it classifies best, and the authors say a correct statement would still not show that it came from introspection.
Betley et al. (2025)Tell me about yourself: LLMs are aware of their learned behaviorsModels fine-tuned to follow a policy that the training data never describes, such as taking risky gambles or writing insecure code, can describe that policy when asked, with no examples in the prompt. Backdoored models can sometimes say they have a backdoor, but do not state its trigger in free text unless trained on reversed examples.
Comsa & Shanahan (2025)Does It Make Sense to Speak of Introspection in Large Language Models?Proposes that an LLM self-report is introspective if it accurately describes an internal state through a causal process linking that state to the report. On that definition, the authors argue, Gemini's account of how it wrote a poem is not introspection, but its inference of its own sampling temperature from text it has just written is a minimal case.
Li et al. (2025)Training Language Models to Explain Their Own ComputationsFine-tuned to put the results of interpretability procedures into words, a model explains its own features and intervention outcomes more accurately than a different model trained on the same examples, even a larger one. It also needs far less training data.
Lindsey (2025)Emergent Introspective Awareness in Large Language ModelsClaude Opus 4 and 4.1 detect and correctly name a concept vector injected into their activations on about 20% of trials at the best layer and strength, with no false positives on control trials. Some models also consult their earlier activations to judge whether a prefilled output was their own, but the author calls these abilities highly unreliable and context-dependent.
Morris & Plunkett (2025)Tests of LLM introspection need to rule out causal bypassingAn intervention that changes a model's internal state can also cause an accurate report of that state by a path that skips the state, so accuracy after an intervention does not show the report is grounded. The authors name this causal bypassing and say the only test they know that rules it out is asking a model whether a concept was injected, a claim a later edit to the post hedges.
Plunkett et al. (2025)Self-Interpretability: LLMs Can Describe Complex Internal Processes that Drive Their Decisions, and Improve with TrainingAfter fine-tuning on choices generated from random attribute weights, GPT-4o and GPT-4o-mini state those weights with a correlation of about 0.5 to the weights their choices reveal. Training on correct reports raises this to about 0.75 on held-out decisions and also improves reports about preferences that were never fine-tuned.
Song et al. (2025)Language Models Fail to Introspect About Their Knowledge of LanguageAcross 21 open-source models, answers to metalinguistic prompts predict a model's own string probabilities no better than they predict those of a near-identical model. The authors find no evidence of privileged self-access to grammatical knowledge or word predictions.
Song et al. (2025)Privileged Self-Access Matters for Introspection in AIProposes that introspection in AI be defined by privileged self-access: a process that tells a model about its internal states more reliably than any process of equal or lower computational cost available to a third party. In a temperature self-report task, four models' reports follow the framing of the prompt, and self-reflection is no more accurate than another model's prediction, with accuracy no better than a random baseline.
Hahami et al. (2026)Detecting the Disturbance: A Nuanced View of Introspective Abilities in LLMsIn Llama 3.1 8B, apparent success at answering "did you detect an injected thought?" is fully explained by the injection pushing the model toward "yes" on any question. The same model can still say which of ten sentences was injected (up to 88%) and which of two injections was stronger (up to 83%), but only when the injection is in the first few layers.
Pearson-Vogel et al. (2026)Latent Introspection: Models Can Detect Prior Concept InjectionsQwen2.5-Coder-32B carries information about a concept vector that was injected during an earlier turn and then removed, including which concept it was. The signal peaks around layers 58 to 62, is weakened by the final layers, and reaches the output only under some prompts: with a document explaining introspection, P("yes") is 39.9% with injection and 0.8% without.
Berglund et al. (2023)Taken out of context: On measuring situational awareness in LLMsModels fine-tuned on written descriptions of fictitious chatbots, with no examples, can sometimes act as described when the description is absent from the prompt, but only if each description is paraphrased many times; accuracy rises with model size. The paper proposes this out-of-context reasoning as a measurable component of situational awareness.
Treutlein et al. (2024)Connecting the Dots: LLMs can Infer and Verbalize Latent Structure from Disparate Training DataA model fine-tuned on documents that each hold one indirect observation of a hidden fact (a distance to an unknown city, a coin flip, one input-output pair of a function) can afterwards state the fact and use it, with no examples in the prompt and no chain of thought. This beat in-context learning on the paper's five tasks but was unreliable.
Bai et al. (2025)Explicitly unbiased large language models still form biased associationsEight chat models that pass standard bias benchmarks still pair social groups with stereotyped words, and make matching choices between people, when tested with indirect prompts adapted from psychology. The models are never asked about themselves.
Cywiński et al. (2025)Eliciting Secret Knowledge from Language ModelsModels fine-tuned to act on a secret while denying they know it can still be made to give it up: prefill attacks let an auditor recover the secret with over 90% success in two of three settings. Logit-lens and sparse-autoencoder readouts of the activations also help the auditor, though less.
Lindsey et al. (2025)On the Biology of a Large Language ModelCircuit tracing in Claude 3.5 Haiku finds the model's account of its own computation matching the mechanism in one case and diverging in others: it describes carry-the-one addition while computing the sum another way, and a chain of thought can be genuine, invented, or worked backwards from a user's hint. Whether it answers a question or says it does not know depends on "known answer" features that can be active for a familiar name when the answer is not known.
Wang et al. (2025)Simple Mechanistic Explanations for Out-Of-Context ReasoningOn Gemma 3 12B, a one-layer LoRA fine-tune that produces out-of-context reasoning mostly adds a single constant vector. A steering vector trained directly on the same data also makes the model state a behavior or fact it was only trained to act on.
BibTeX
@inproceedings{atkinson2026,
  title = {{Identifying Introspection From the Inside}},
  author = {David I. Atkinson and Dillon Plunkett and David Bau},
  year = {2026},
  booktitle = {COLM 2026},
  url = {https://iii.baulab.info}
}